Learning Objectives - After this class you will be able to upload your own data, add existing data, and create a workspace
Resources:
Sample Data - This data is a CSV file containing sample sales data based in the United States, complete with contact name and details, company name and details, and address information. This dataset is suitable to be used in the Practical Exercises throughout this course. (Learning Academy Sample Data)
Link to Boundary Sample Data - This data is a CSV file containing sample zip code data based in New York. This dataset is suitable to be used in Practical Exercise 2 – Link to Boundary. (Manhattan Zip Codes)
The first step to add data to eSpatial is to go to the + Maps tab, and choose the + Create Map option. This will then open a New Workspace where you can add your data to the map.

The Add Data window will then appear, and you will then be prompted to either Upload new data or choose an Existing Dataset already in eSpatial. Select the Upload new data option and choose either your own data file, or the one provided in the resources section. Click Open to advance to the next stage of upload.

You can also use the Add Data option in the eSpatial control panel to upload new data.
%20Control%20Panel.png?width=250&height=259&name=(Class%201)%20Control%20Panel.png)
After clicking Open, the next screen you see will be the Upload Data Screen, where the location columns that are used to map your data are found. If you wish to change your location columns, you can click the Change Settings option. You can also manage the other columns in your data from here.
%20Normal%20loaction%20coulumn%20SS.png?width=500&height=332&name=(Class%201)%20Normal%20loaction%20coulumn%20SS.png)
Your location columns dictate how you want your data to be plotted. In the example above, we have the exact address, so that is why its top of the list. Clicking the Change Settings option will open the Location Settings menu. Here, you can change the order of your location columns by dragging the options into place. If you want to add or remove a location column, click on the column name in the list and then on the arrows in the middle.

The Coordinates tab lets you set your Lat/Long columns and set a projection, while Link to boundary lets you plot data points as boundaries.
When you are happy with your location columns, click Complete. You will then see the progress of your data being uploaded. Once this has reached 100%, click Return to Map to view your plotted data.


During the upload process there may be some locations that cannot be plotted. These will show up as No Locations at the end of the upload.

If this occurs, click the Cog icon next to the dataset in the control panel and choose the Manage Locations option to view which locations did not plot.
%20Manage%20Locations%20SS.png?width=500&height=300&name=(Class%201)%20Manage%20Locations%20SS.png)
Link to boundary
Link to boundary is another way of uploading your data to eSpatial. It allows you to link a pin dataset to an existing boundary dataset from the eSpatial library. So, instead of a pin representation of your data, you get an area representation of your data. It is a great way of generating a complete map picture to easily compare area to area in a single view and a great alternative to a pin map. In the following two images, we show you the same data in a simple pin map, and the same data in a link to boundary map. You can see how different the maps are using the same information, and yet the output looks so different. Depending on the story you are looking to tell, both maps can be incredibly useful.
%20LTB%20Just%20Pins.png?width=300&height=307&name=(Class%202)%20LTB%20Just%20Pins.png)
%20LTB%20.png?width=300&height=305&name=(Class%202)%20LTB%20.png)
The link to boundary function can be accessed by clicking the Change Settings option on the Upload Data screen. Once the Location Settings menu is open, choose the Link to boundary option.
%20Link%20to%20Boundary%20settings.png?width=500&height=324&name=(Class%202)%20Link%20to%20Boundary%20settings.png)
Clicking the Configure button will open a new window where you can choose the dataset that you want to link to. This can be either a dataset that you have already uploaded, or one from the eSpatial datastore. If the dataset is one you have already uploaded or that you have already added to your account from the eSpatial datastore, then select the Datasets tab. If it has not yet been added to your account, then select the eSpatial Datastore tab.
%20LTB%20Configure.png?width=500&height=330&name=(Class%202)%20LTB%20Configure.png)
You can search for a dataset by scrolling or using the search bar and click the Select button once you have found the dataset that you want to link to. The Configure screen is where you match the location column in your existing dataset to the one you have selected. In the example below, the Zip column in both datasets have been chosen. You can choose which columns to match by checking the circle at the bottom of the column.
%20LTB%20Match.png?width=500&height=330&name=(Class%202)%20LTB%20Match.png)
Once this is done, click OK, and then OK again at the Location Settings menu. You will then be returned to the Upload Data screen below. Here you will see the existing dataset that you have chosen as the boundary, and the columns that have been linked in each dataset. Clicking on Complete will upload your data.
%20LTB%20Upload%20Screen.png?width=500&height=334&name=(Class%202)%20LTB%20Upload%20Screen.png)
As the example below shows, your data will then be added as boundaries rather than pins.
%20LTB%20CBV.png?width=500&height=512&name=(Class%202)%20LTB%20CBV.png)
Creating a new workspace and adding Data from library
A Workspace is where you create your maps. You can create different Workspaces for the different projects you are working on, and these will all be stored in your library. A workspace can contain multiple maps.
To create a workspace, go to the Red Create Maps tab, and choose the + Create Map option. Your new workspace will then open and be given the default name of the date and time that it was created. We will show you how to change this further on in the course.
When prompted, on the Add Data Screen select Existing Datasets, or use the Add Data option in the eSpatial control panel. After choosing Existing Datasets, the Add from Library screen will appear. Here you will see suggested datasets, datasets that you have previously used or uploaded to eSpatial, and datasets already loaded to the eSpatial datastore. The Datasets tab stores all datasets that you have uploaded, while the eSpatial datastore contains point and boundary datasets from across the globe. You can use the search box to look for datasets to add to your map.
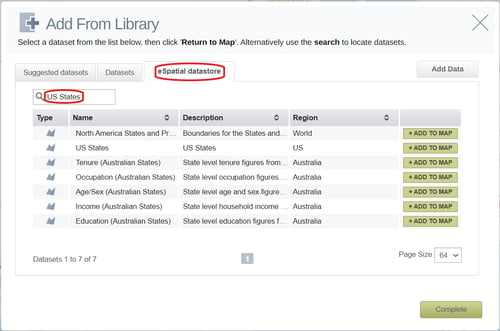
Once you have found the desired dataset, click the Add to Map button to add this dataset to your map. Click Complete to return to your map with the new dataset added.
Practical Exercise 1 – Creating a Workspace and Adding Data
Overview – This exercise is centered around uploading, adding data, and creating your own workspace.
- Download the sample account data provided in the resources section or use your own data.
- Create a new workspace and go through the necessary steps to upload your data
- Ensure the location columns are correct, and if they are not, edit them
- Add a boundary dataset (e.g US States, Counties) from the Library
- Save your newly created map.
Practical Exercise 2 – Link to Boundary
Overview – This exercise allows you to put what you learned about creating a Link to Boundary map into practice.
- Download the sample Link to Boundary data provided in the resources section or use your own data.
- Link the data to an existing eSpatial Dataset (e.g Zip codes 2022) using a location column that is common to both
- Save your newly created Link to Boundary map.