Learning Objectives – Gain an understanding of the Panning and Zooming functions, selecting data from your map, info pop ups, buffers and filtering.
Panning and Zooming
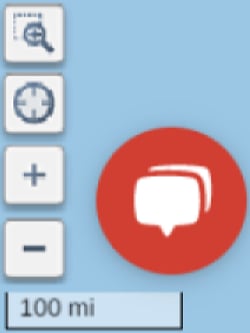
You can zoom into your map either using the wheel on your mouse or the + and – symbols in the bottom left of your screen. Here, you will also find the Zoom to Area option, which is the first of the 4 symbols. This allows you to draw a polygon on your map and zoom to the area within it. The second from top icon, labelled Show my location, will zoom to your current location if Geolocation is switched on in your browser. There is also a Scale Bar that changes depending on zoom scale.
Selecting data from the map and Info pop ups
You can select data from your map by clicking on a datapoint. The color of the selected point will then change briefly while the point is selected. In the below example, the color of the selected point has changed from red to blue. Once deselected the color of the point will go back to red. The info pop up will also appear once a point has been selected. This pop up will contain all fields that are present in your excel file, and all the info relevant to the selected point within those fields. Within the info pop up there are Edit, Delete, and Close icons in the top right of the pop up.
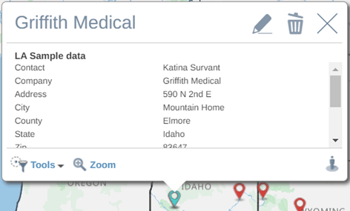
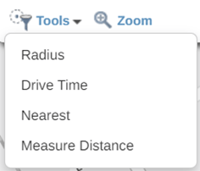
In the bottom left of the pop up, you will find the Tools, Zoom, and Street View options. Clicking Tools will open a dropdown menu containing the four options below.
Clicking the Zoom icon will zoom in to a street level view of the selected point.
Clicking the Zoom icon will zoom in to a street level view of the selected point, while the Street View icon will open Google Street View in a separate browser tab.
Buffers from point
There are two types of buffers that can be created from a point, Radius and Drive Time. These can be accessed from the Tools dropdown.
Radius
The Radius buffer allows a circle to be drawn around a point or points on a map, representing a distance of your choice. This is created using straight line distance from your starting location. After clicking the Radius option from the Tools dropdown, the radius settings menu will open.
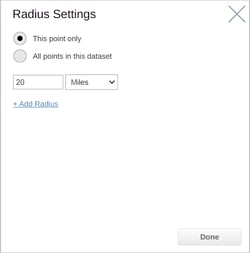 From here you can, choose whether to create your radius from a single point, or from all points in the dataset. You can also choose the distance of your radius by typing a figure into the text box. The dropdown next to the textbox will allow you to change the distance criteria to either miles, kilometers, feet, or meters. The Add Radius option lets you add up to three radii of different sizes. Once you have decided on your settings, the result will look something like the below, which is an example of a 100 and 200 mile radius.
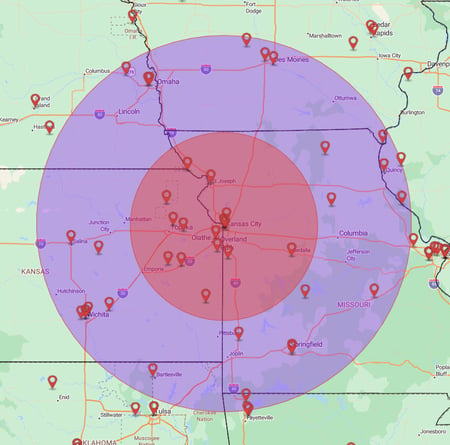 You can change the color, border, and transparency of your radius using the style menu.
Drive Time
The Drive Time buffer allows you to show the area you can travel to from a specific location within a given time limit. This is created using road networks, speed limits, and other relevant data. The Drive Time buffer can also be accessed from the Tools menu.
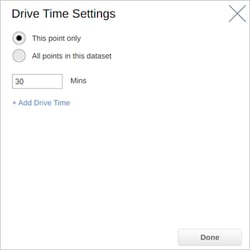
From here, you can choose whether to create your buffer from a single point, or from all points in the dataset. You can also choose the drive time allowance of your buffer by typing a figure into the text box. This can be up to a maximum of 120 minutes. You can add up to 3 buffers using the Add Drive Time option.
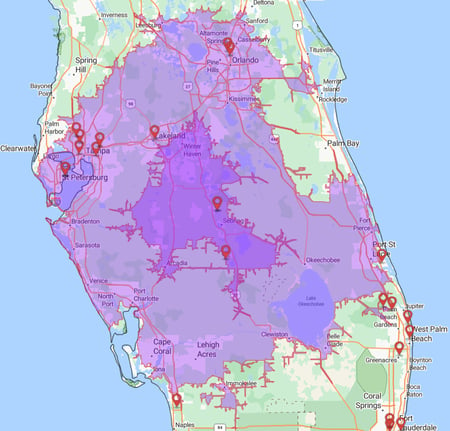
Like the radius buffer, you can change the color, border, and transparency of your Drive Time buffer using the style menu.
More information on Radius and drive time buffers and how they can be used on maps is available in Module 5, Class 5 and 6. Information on Nearest Neighbor maps can be found in Module 5, Class 7.
Filters
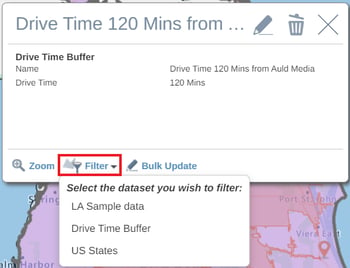
You can filter from within both a Radius and Drive Time buffer. This is useful if you want to only see the information that falls within your buffer. Clicking anywhere inside the buffer will open the info pop up. From here, clicking on the Filter option will give you a list of the datasets that you can filter by.
The list of points from your selected dataset that fall within the drive time buffer will be available to view in the table.
Bulk Update
You can update multiple records at once using the Bulk Update tool. You can use custom areas, territories, buffers or geographic boundaries such as States to update multiple records at once.
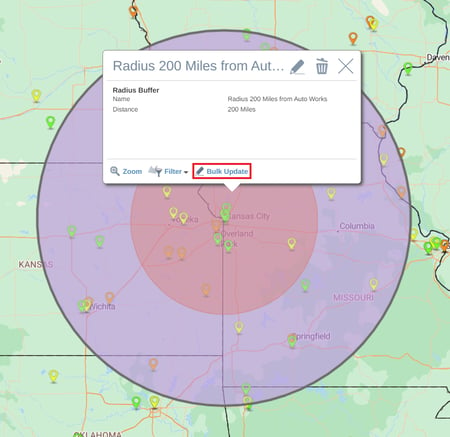
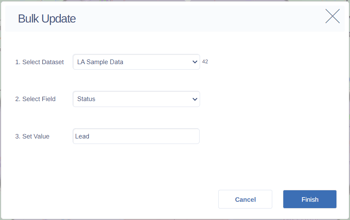
Click anywhere inside your area of choice to open the info pop up, and select the Bulk Update option. This will open the Bulk Update Settings window. Here you can select the dataset you want to update, the field within this dataset you want to update, and the value you want to update to.
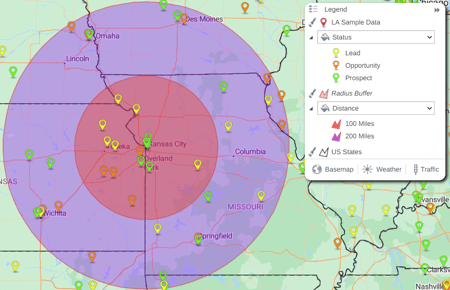
 Once you press finish, your records will be updated to reflect the new value and their color will also updated accordingly. In the below example, bulk update will be used to set all of the records within the radius buffer to a Lead status. As the legend shows, a lead status is colored yellow, and there are three different colored pins within the radius.
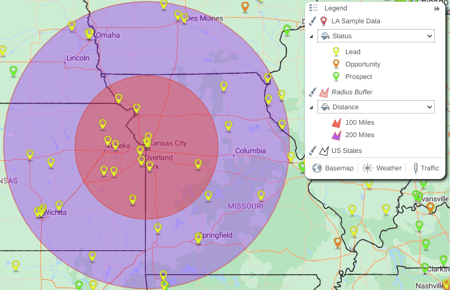
 After using bulk update and setting the Status field to Lead, all of the records in the radius are now yellow, the color assigned to a lead.
Measure Distance
The Measure Distance option in the Tools menu allows you to quickly measure the distance between two or multiple points, or calculate the area of a polygon. The output includes straight line distance, driving distance and drivetime for points and multipoints. It also includes the area for a polygon.
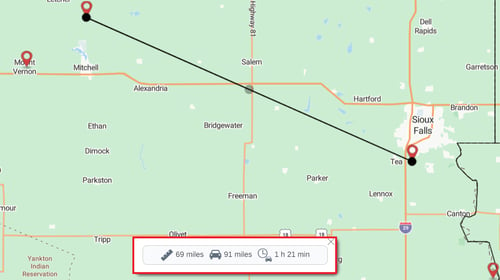
After selecting your starting point and choosing Measure Distance, the measure tool crosshair will appear on the screen. You can then click anywhere on the map to measure the distance to that point. The Distance Pop up showing the straight-line distance in miles, the driving distance in miles, and the driving time will then appear at the bottom of the screen.
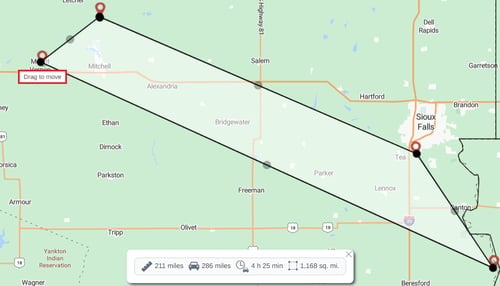
You can continue clicking on your map to continue adding points to your measurement calculation, or you can click on any of the points to drag and move them to edit the measure line. You can also create a polygon after adding several nodes by clicking on the starting point. This will also add the area in square miles to the Distance pop up.
To remove a point, you can simply right click it. You can remove the measurement line/shape by clicking the X on the Distance Pop up.
Distances and areas can be displayed in Miles or Kilometers. To change the unit, go to user settings found under your username at the top right in the application. On this screen, change the Measurement Systems between Imperial and Metric to switch between the two.
Practical Exercise 5 – Buffers
Overview – This exercise allows you to try adding your own buffer to a map.
- Add a drive time or radius buffer to your map.
- Experiment with distance/time settings and using multiple buffers.
- Customize your buffer by changing the color and transparency of your buffer(s).
- Use the filter option to filter to the points within your buffer.