Learning Objectives – After completing this class you will have a strong understanding of the benefits, use cases, and best practices of Radius Maps.
What is a Radius Map ?
The Radius map allows you to show a circle representing your chosen distance around a point or points on a map. This is created using straight line distance from your starting location. For example, you might want to display all customers within 10 mile radius of your sales or service reps on a map.
Use Cases
The Radius map can have many use cases.
- Sales operations teams use radius maps to uncover gaps in sales or service territories.
- Marketing operations use radius maps when planning campaigns or events.
- HR and recruitment managers can display candidates located within a set radius, making their hiring process run smoother.
- Analyze sales or service territories to improve efficiency.
- Use to identify new locations for offices or franchises.
- Create coverage assignments for outside sales reps or new expansion opportunities.
- Make resourcing decisions about outside sales reps, service teams, and assets like trucks.
- Real world scenario for marketing - You are planning an event in San Francisco and want to select the best locations within a 1-mile radius of your customers. You plot all venues within your desired area and compress your planning cycle.
Benefits
- Using radius time maps leads to more informed decisions on optimizing resources.
- Understand travel time constraints and optimize service and sales operations and planning.
- Great for scenario planning, as you gain new insight faster.
- Ultimately, you get to redeploy resources to underserved but high-potential areas.
- Uncover areas you may need to right size so you can redeploy resources to higher priority areas.
- Reduce advertising spend by focusing on customers within a targetable radius of your location.
Best practices
- Establish clear objectives for using radius maps, whether it is for selecting store locations, optimizing service areas, or uncovering underserved markets. Having well-defined goals help to focus the analysis and lead to actionable insights.
- Try different radius buffer distances to create scenarios and refine your analysis.
- Continuously monitor the performance of your service area optimizations or targeted marketing campaigns, and be willing to adapt as needed to take advantage of changing markets, shifting resources or new opportunities.
Steps to create
Radius Buffer
The first step is to select the point you wish to add the radius buffer to. When the info pop - up appears, select the Tools dropdown, and then the Radius option. The radius settings menu will then open. From here you can, choose whether to create your radius from a single point, or from all points in the dataset. You can also choose the distance of your radius by typing a figure into the text box. The dropdown next to the textbox will allow you to change the distance criteria to either miles, kilometers, feet, or meters. The Add Radius option lets you add up to three radii of different sizes.
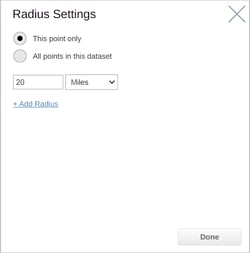
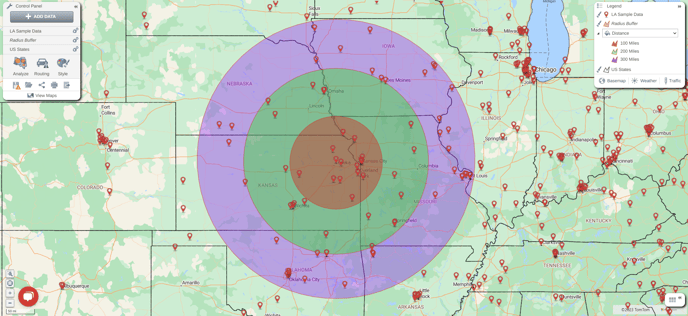
Once you have chosen your radius distance(s), select done and your radius buffer(s) will appear on your map.
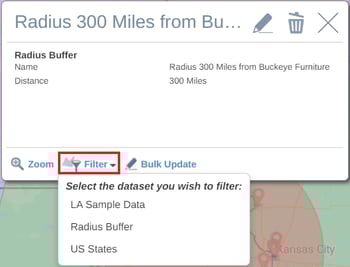
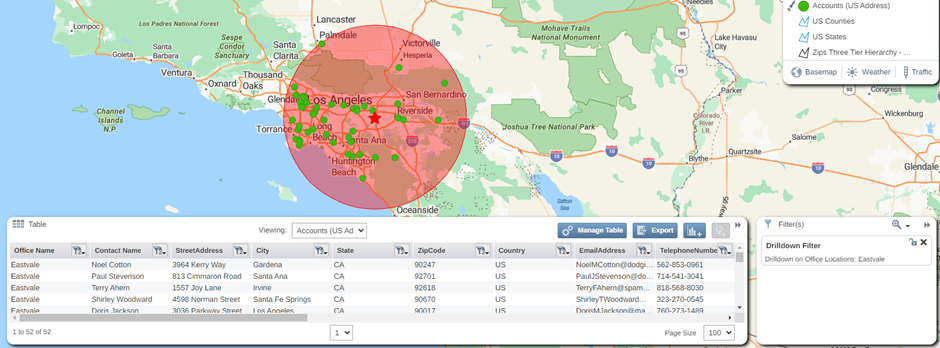
If you want to filter your data within the radius buffer, click on the radius buffer and click on Filter in the Radius buffer pop-up window, then select the dataset you want to filter. You can then expand your table to view a list of points in the selected dataset that fall within the radius buffer.
Radius Analysis
For the Radius Analysis function to work, you will need at least 2 datasets added to your map. At least one of these Datasets must be a Pin dataset.
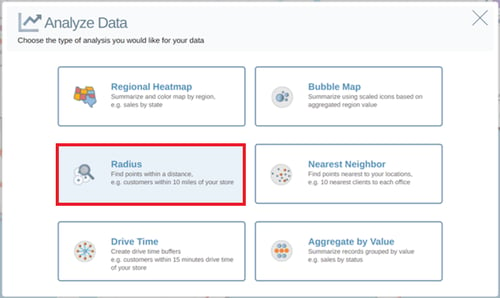
To add a Radius Analysis to your map, select Analyze in your Control Panel and click on the Radius option in the Analyze Data window.
This will then open the Radius settings window. Here you can select the dataset you wish to find the results within your specific distance for, using the Find drop down. You can then choose the distance you want to find data within by typing a number in the text box, and select a distance type from the drop down. Select the From Center Points dataset you wish to use from the drop down. These are the points in which your radius buffers will be built from.
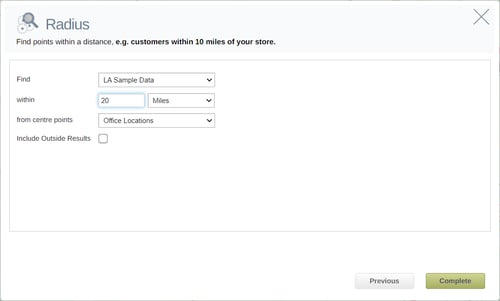
Once you have your settings in place, click the Complete button to add your radius analysis to your map.
The difference between the Radius Buffer and the Radius Analysis functions, is that the points within the Radius buffer(s) are already filtered and aggregated by your radius buffers in your table when the Radius Analysis function is used.
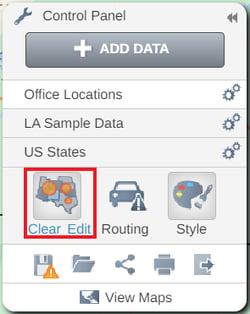
You can use the Control panel to Edit or Clear your analysis by choosing one of the options.
Understanding your Radius Analysis data
Radius Center Point Dataset
When you expand the table, you will see your values aggregated by your radius buffers.
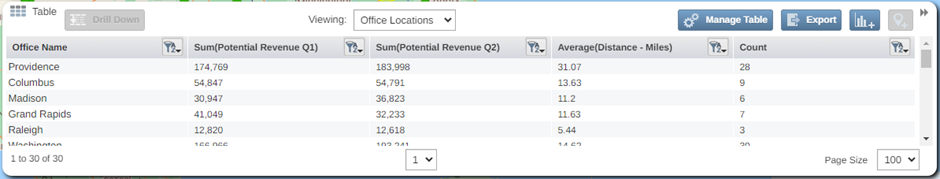
If you chose to include outside results from the Radius settings, you will also see a category called Outside that sums all the pin values that fall outside your radius buffers. You can also include additional numerical columns to this table by selecting selecting Manage Table in the top right of your table. To see a more detailed view of the pins that fall within a radius buffer, click on the center point record in the table and select the drill down option.
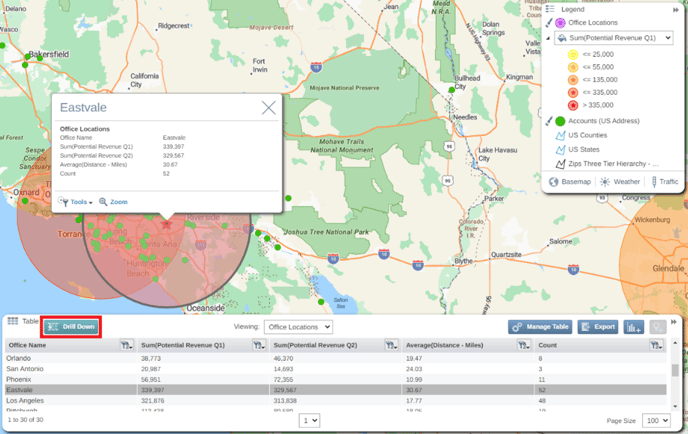
This will navigate to the pin dataset in your table filtered to your selected radius.
Pin Dataset
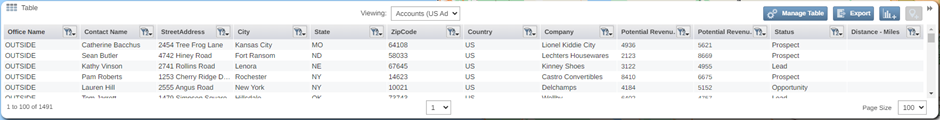
Alternatively, you can also see all your pin data on your table by using the navigation bar. This data will display with an additional column stating which center point radius buffer the pin sits in as well as the straight-line distance from that point to the center point location. If you have included outside results the center point location label will display as OUTSIDE for pins not located within your radius buffer dataset.
Trend spotting tips
You can use the following tips to identify patterns, opportunities or trends using radius analysis maps.
- Look for clusters or concentrations of businesses or customers within a radius. These can indicate areas with high demand for certain products or services. Analyze these clusters to identify market trends or potential business opportunities.
- See the proximity of competitors within a specified radius of your proposed business location. This can allow you to avoid areas of high competition and target areas that are underserved or have fewer competitors.
- Likewise, look for concentrations of complementary businesses in specific radius buffer area that attract a similar customer base or offer opportunities for collaboration. Look for areas in which you have no coverage, so areas that are not within the radius of your stores/reps/engineers.
- Look at potential new sites for your business. Is there a large cluster of business near none of your existing resources? This could be the ideal location for your next hire, or store.